
As noted in Loyalty Measurement: C-Suite Needs a Balanced Scorecard, executives need a balanced presentation of results to gauge program performance. As part of that, loyalty practitioners must measure and optimize the incremental impact of their programs. LoyaltyLevers Balanced Scorecard provides a unique solution to the challenge of causality. This article goes deeper into measuring Behavior changes and translating that into an estimate of incremental margin attributable to the program.
Deeper Dive on Measuring Behavior Changes
Measuring ROI for Loyalty programs is tricky due to challenges in establishing causality: does the loyalty program increase the customer’s spending, or do better customers find it valuable to join the program? Due to this self-selection bias, the LoyaltyLevers approach focuses on measuring changes in key measures, and using those as the basis for estimating the impact on profit margin.
Each of the Key Measures is comprised of 10+ individual metrics that are aggregated in a weighted fashion that is customized for each brand. The measures are then tracked over time, providing a read of results across pre-planned test cases for different member segments. As usage of these Key Measures matures, you’ll gain a good sense of the relationship between gains in the measures and differing loyalty strategies. Through a robust test and learn program, targeting member segments with varying treatments, you’ll begin to get a sense of the baseline – what would performance be without the loyalty program itself?
In the simplified example below, transactional frequency is analyzed across different testing scenarios within each of three key customer segments. The testing scenario baseline is No Promotion, which entails doing no extraneous promotion or communications. For obvious reasons, this group should be kept as small as possible while still providing reliable results. Then, for each segment, additional program elements are measured, for example adding targeted incentives, and layering on a surprise and delight benefit to gauge the full program impact. By reading results at a Segment level, you’ll gain accuracy and also insight regarding which kinds of treatments work best with which audiences.
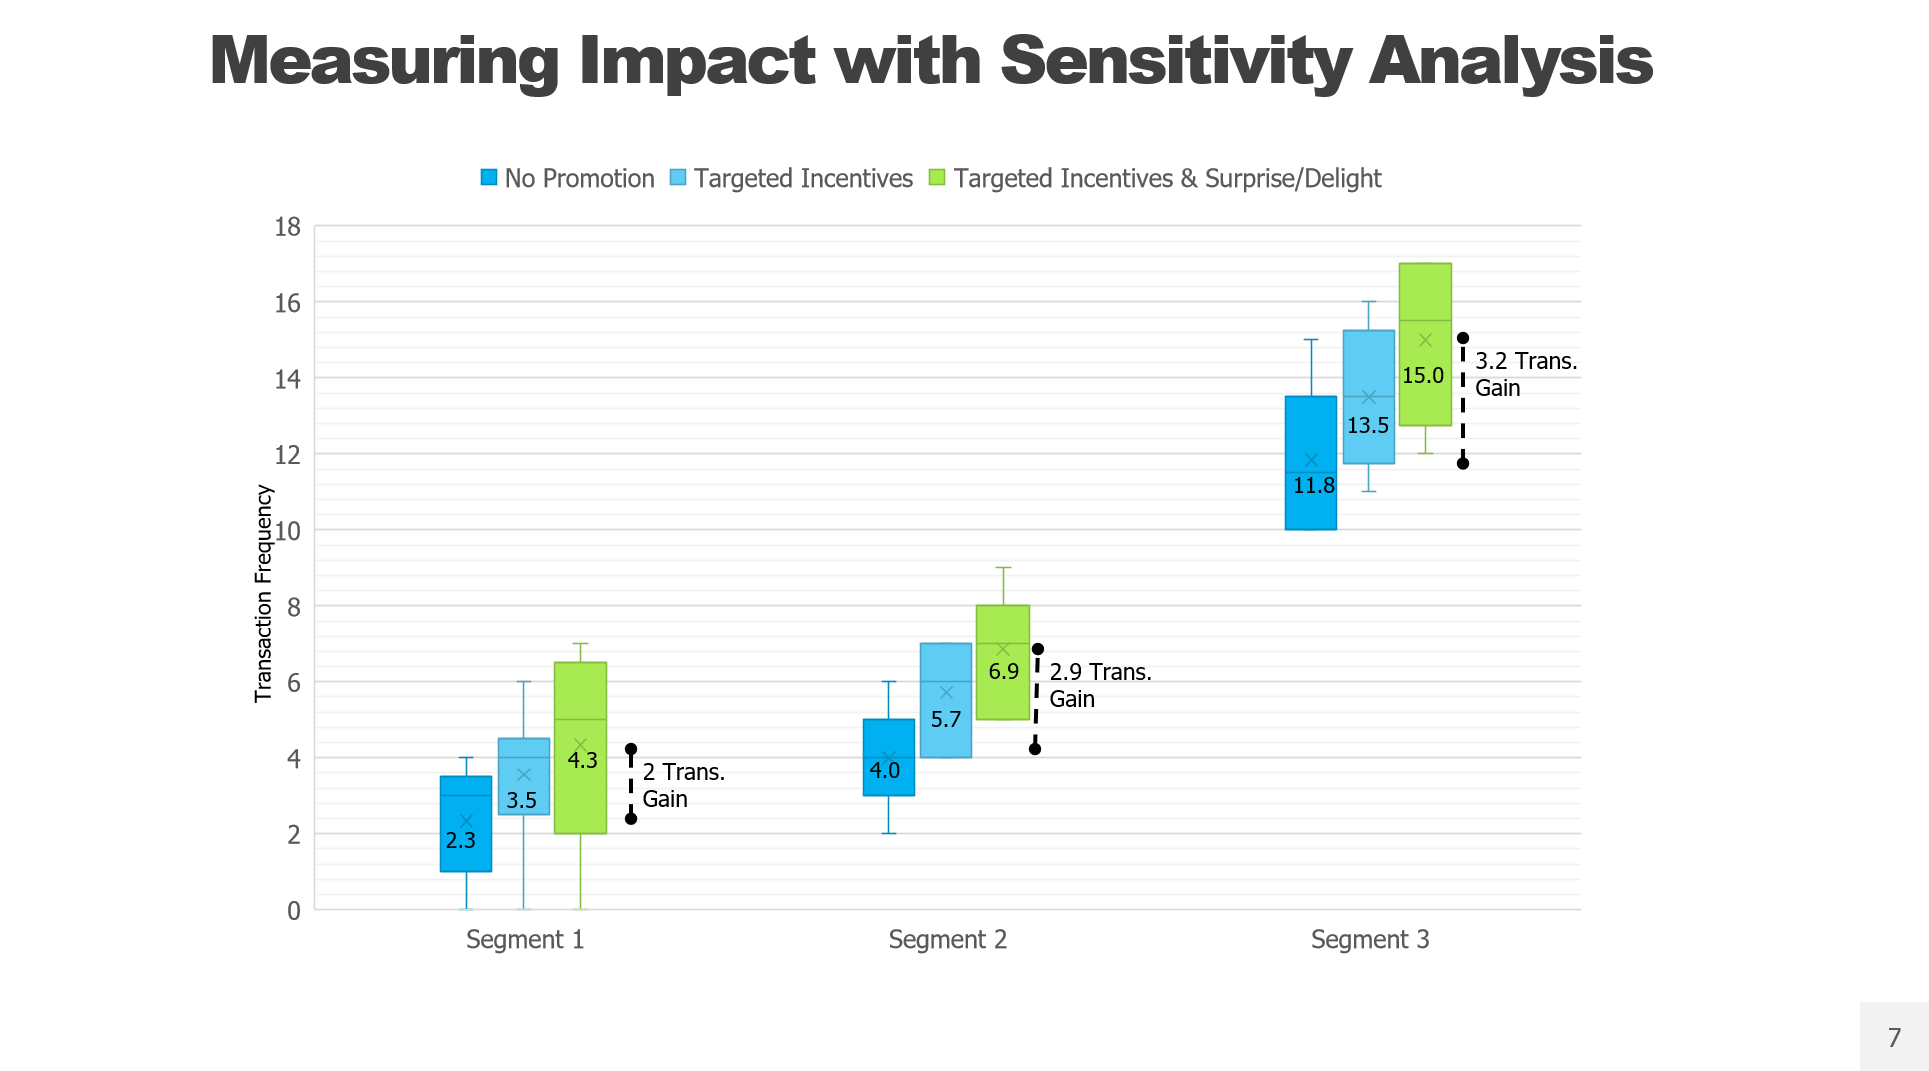
In the example, for Segment 1 you see a gain of almost 50%, from 2.3 transactions to 4.3 transactions. This suggests that the elusive “No Program” frequency would certainly be below 2 transactions, but to be conservative let’s assume 2.3 transactions. So in this case, we estimate the promotional rewards are adding 1.5 transactions, while the combined rewards and surprise delight treatment is adding 2 transactions. This type of gains analysis can then easily be translated to revenue and margin with segment specific data. Similar analysis can be done linking engagement to loyalty sentiment, engagement or any combination of key measures.
Once the “no program” baselines are established, the thorny question of incremental impact can be set aside for periodic reevaluation. The focus can then turn primarily towards optimizing the Behavior metrics that drive revenue and profit: member acquisition and retention rates, transaction frequency, and ticket size. Rewards and program administration costs represent another key component to the profitability calculation.
Note, the LoyaltyLevers approach focuses on changing customer behavior, vs viewing the loyalty currency as a profit center and driving currency sales through coalition partners and the like.
LoyaltyLevers Take:
Substantive ongoing test and learn scenarios must be developed in order to discover winning strategies to introduce new Behavior Drivers that will increase program impact. Drive the loyalty team to be ambitious and creative in their thinking because history has proven that innovators win in the loyalty space. Learn more about best practices on introducing powerful Behavior Driver benefits.
Comments